
The following FAQ outlines helpful answers for common questions on report creation and general tips for best practices in reporting. For more detail on Cross-Object Reporting, please see the child page Cross-Object Reporting FAQ.
REPORT CREATION
Choose Data Series
What fields am I trying to access in my final report?
What object stores those fields?
Select Filter Criteria
Which fields should be used?
How should those fields be populated?
Select Results Display
What information do I want to present in my report?
Do I need to make any adjustments to properties?
Formatting
What type of chart do I want to use?
How do I want to group my results?
TIPS AND TRICKS
CHOOSE DATA SERIES
Use the identifiers (pictured below) to determine in which object your data is stored. Each different object will have its own Data Series to be used for reporting.
Embedded Objects appear in the Data Series drop-down list indented below their parent object
SELECT FILTER CRITERIA
Use Shift and/or Control on Multi-Select Lists when choosing multiple filters
Use Parameters for filters that can be manually changed at run-time
Parent Objects can filter based on Embedded Object fields
SELECT RESULTS DISPLAY
Change Label property to add clarity to results
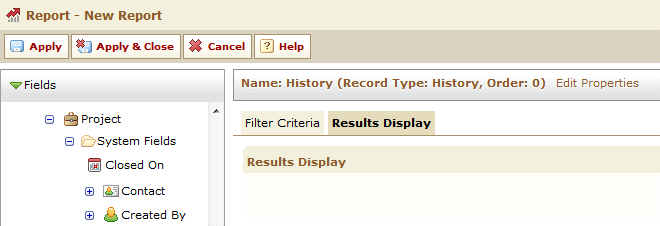
Only Embedded/Related Objects can include fields from Parent Objects in Results Display
FORMATTING REPORT
1)Chart Type – select different chart options to find the one that works best
•Options: Bar, Column, Pie, Line, Area
2)Chart Sub-Type – change style of chart, especially useful with multiple data series
•Options: Clustered, Stacked, Clustered 3D, Stacked 3D
3)Legend – determine where on the screen the legend should reside if at all
•Options: Bottom, Right, None
4)X-Axis – set how x-axis labels should be displayed, especially useful with long labels
•Options: Wrap, Vertical, Slant, Stagger, None
5)Labels – choose whether labels for values should be included on report output
•Options: Show, Hide
6)Results – filter report to only show the Top or Bottom results and how many
•Options: All, Top, Bottom
FAQs
Q: Is the Data Warehouse the same as one that is used for Business Objects reporting?
A: Yes. The Data Warehouse used for TeamConnect’s Native Report is the same repository of information that would be used if working with Business Objects for reporting purposes.
Q: What is a Unique Key?
A: The Unique Key is used with TeamConnect’s localization capabilities, which allows you to translate TeamConnect to appear in different languages. A Unique Key is referenced when matching the
existing language to the newly translated language. If your organization does not localize
TeamConnect, a Unique Key does not need to be entered.
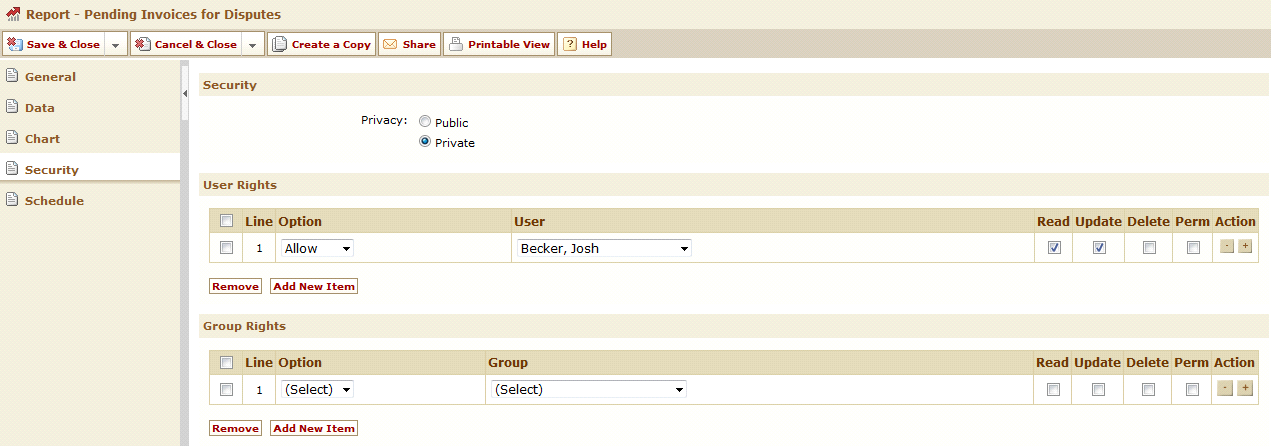
Q: How granular are the security options in the Reporting feature? For example, can you allow certain users to run reports only, while others can both run and create reports, but also locking users to certain group-specific folders, etc.?
A: Based on a user’s rights, you can control what a user is able to do in general with reporting including whether he/she is able to simply view a report, or do other things like edit reports, create reports or delete reports. Additional security can also be set at the Report level or at the Folder level, which would cascade down to every report in that folder. This higher level of security allows you to grant rights that are specific to a report that has been marked as Private. In the example below, although there are a number of users in the system with the proper reporting rights, only I would be able to read or update this report because it is private and only I have been granted the necessary rights on this particular report. I would not be able to access other private reports without being granted specific permission.
Q: Can multiple Data Series be included in a single report?
A: Yes, you can include any number of Data Series in a report based on your particular needs.
Graphical reports will include every Data Series in the graph output. Pie charts will have a separate pie for each Data Series. Tabular reports will display the Data Series side by side, but not in the same table. Please note that if creating a graphical report with multiple Data Series, you must use the same “Group By” field for each Data Series. This is not required for Tabular reports.
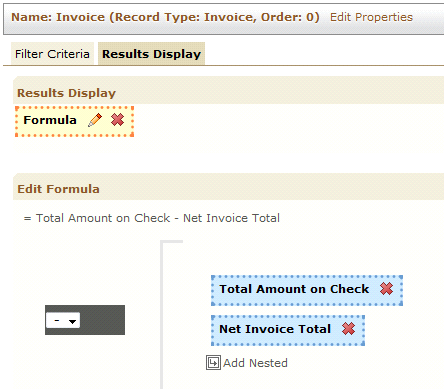
Q: Can report results include a formula?
A: Yes assuming you are using version 3.3 SP1 or later. By dragging Formula into the Results Display, you can then edit the formula to combine multiple numeric fields together using the standard arithmetic functions (add, subtract, multiply, divide).
Q: How do you change the logic for report filters?
A: You can choose between using “And” and “Or” logic when determining the proper filters for a report to provide you with the flexibility to pull in exactly what you need into your final report. To change from “And” to “Or”, or vice versa, simply click directly on the “And” or “Or” and it will change to the other option.
Q: If I schedule a report, how will the results be sent to me?
A: When creating a report’s Schedule, you have the ability to determine whether the results should be attached to the email as an Excel file or as a PDF. You also have the ability to determine whether you want to include the graphical report, the tabular data, or both. Please note only TeamConnect users can be set as the recipient of a scheduled report.
